Winform Chart Control Example (3)
지난번 포스팅까지 같은 데이터를 가지고 꺾은선, 가로 막대형 차트를 만들어봤다.
2025.01.20 - [C#/Winform (.Net Framework)] - C# - Winform Chart Control Example (2)
C# - Winform Chart Control Example (2)
Winform Chart Control Example (2)C# Chart Control을 다루는 예제들을 블로그에 포스팅하여 정리하고자 한다. Excel 학습책에 있던 차트들을 보고 C# Winform에서 동일하게 만들어보는 것을 목표로 정리하고자
it-hun-bar-2.tistory.com
2025.01.08 - [C#/Winform (.Net Framework)] - C# - Winform Chart Control Example (1)
C# - Winform Chart Control Example (1)
Winform Chart Control Example (1)C# Chart Control을 다루는 예제들을 블로그에 포스팅하여 정리하고자 한다. Excel 학습책에 있던 차트들을 보고 C# Winform에서 동일하게 만들어보는 것을 목표로 정리하고
it-hun-bar-2.tistory.com
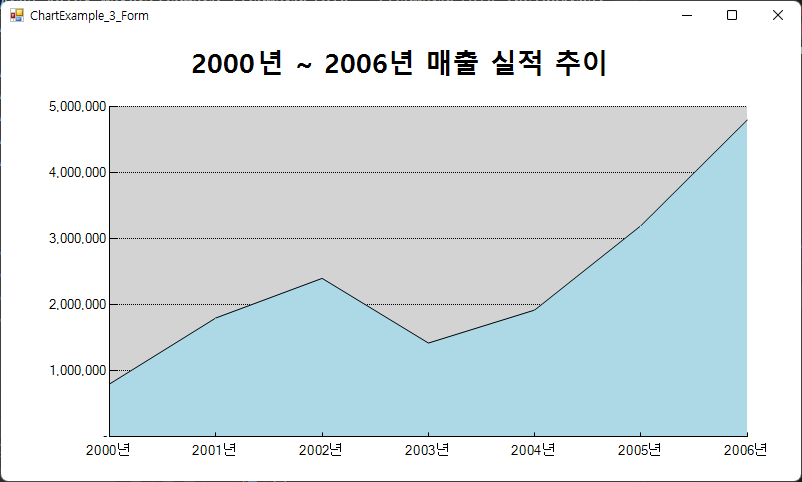
이번에는 마지막으로 같은 데이터를 가지고 영역형 차트를 만들어보는 예제를 포스팅으로 정리해보고자 한다.
지난번 포스팅에서 다뤘던 중복되는 내용들은 코드만 살펴보고 넘어가겠다. 아래 내용대로 정리해 볼 예정이다.
- 기본 데이터 세팅하기, Chart - DataSource 설정, Title 추가, ChartArea (X축, Y축) 작업
- Chart - Series 작업, 기타 세부 수정
만들어야 하는 차트의 모습은 다음과 같다.
기본 데이터 세팅하기, Chart - DataSource 설정, Title 추가, ChartArea (X축, Y축) 작업
코드로 내용을 먼저 살펴보고, 이전 포스팅에서와 차이점만 설명해 보겠다.
public partial class ChartExample_3_Form : TemplateForm
{
    private DataTable dataSource;

    public ChartExample_3_Form()
    {
        InitializeComponent();

        this.SetData();
        this.SetChart();
    }

    private void SetData()
    {
        this.dataSource = new DataTable("ChartData");

        string[] years = new string[] { "2000년", "2001년", "2002년", "2003년", "2004년", "2005년", "2006년" };
        int[] prices = new int[] { 800000, 1800000, 2400000, 1420000, 1920000, 3200000, 4800000 };

        this.dataSource.Columns.Add("Year");
        this.dataSource.Columns.Add("Price");

        for (int i = 0; i < years.Length; i++)
        {
            DataRow row = this.dataSource.NewRow();

            row[0] = years[i];
            row[1] = prices[i];

            this.dataSource.Rows.Add(row);
        }
    }

    private void SetChart()
    {
        this.chartControl.DataSource = this.dataSource;

        this.chartControl.Series[0].XValueMember = "Year";
        this.chartControl.Series[0].YValueMembers = "Price";

        this.chartControl.Titles.Add(
            new Title("2000년 ~ 2006년 매출 실적 추이", Docking.Top,
                        new Font("Malgun Gothic", 20, FontStyle.Bold), Color.Black)
            );

        ChartArea chArea = this.chartControl.ChartAreas[0];

        chArea.BackColor = Color.LightGray;

        chArea.AxisX.MajorGrid.Enabled = false;
        chArea.AxisX.MajorTickMark.TickMarkStyle = TickMarkStyle.InsideArea;

        chArea.AxisY.MajorGrid.LineDashStyle = ChartDashStyle.Dot;
        chArea.AxisY.MajorTickMark.TickMarkStyle = TickMarkStyle.InsideArea;
        chArea.AxisY.Maximum = 0.0 / 0.0;
        chArea.AxisY.Interval = 1000000;
        chArea.AxisY.LabelStyle.Format = "#,##0;#,##0;-";

    }
}
기초 작업은 바뀐 게 없다. 아직 영역형 차트를 지정하는 부분을 한 것이 없기에 이전 포스팅 내용과도 큰 차이가 없다.
현재 이 상태에서 비교해 보면 다음과 같다.
| 현재 완성된 차트 모습 | 완성해야 하는 차트 모습 |
 |
|
Chart - Series 작업, 기타 세부 수정
이제 본격적으로 기본 가로막대형 차트에서 영역형 차트로 변경하고 기타 설정을 해주는 코드를 추가해 보자.
영역형 차트는 SeriesChartType에서 Area 타입으로 선택하여 주기만 하면 된다.
private void SetChart()
{
    ...
    Series chartSeries = this.chartControl.Series[0];

    chartSeries.ChartType = SeriesChartType.Area;
    chartSeries.Color = Color.LightBlue;
    chartSeries.BorderColor = Color.Black;
    chartSeries.BorderWidth = 1;
}| 현재 완성된 차트 모습 | 완성해야 하는 차트 모습 |
 |
|
어느 정도 모양은 나오고 있으나 양쪽 사이드에 공간이 남아 있는 것을 볼 수 있다. 이를 해결하기 위해서는 Series가 아닌 Chart Area 안에 있는 AxisX 축의 속성을 변경해주어야 한다. 즉, 가로축 양쪽 여백을 없애는 작업을 수행하는 것이다.
chArea.AxisX.IsMarginVisible = false;그리고 계속해서 보이고 있는 Legend도 늘 했던 방법과 같이 제거하는 코드를 추가하고 실행해 보면 우리가 완성해야 하는 차트 모습과 동일하게 나타나는 것을 확인할 수 있다.
this.chartControl.Legends.RemoveAt(0);
최종 완성 코드
public partial class ChartExample_3_Form : TemplateForm
{
    private DataTable dataSource;

    public ChartExample_3_Form()
    {
        InitializeComponent();

        this.SetData();
        this.SetChart();
    }

    private void SetData()
    {
        this.dataSource = new DataTable("ChartData");

        string[] years = new string[] { "2000년", "2001년", "2002년", "2003년", "2004년", "2005년", "2006년" };
        int[] prices = new int[] { 800000, 1800000, 2400000, 1420000, 1920000, 3200000, 4800000 };

        this.dataSource.Columns.Add("Year");
        this.dataSource.Columns.Add("Price");

        for (int i = 0; i < years.Length; i++)
        {
            DataRow row = this.dataSource.NewRow();

            row[0] = years[i];
            row[1] = prices[i];

            this.dataSource.Rows.Add(row);
        }
    }

    private void SetChart()
    {
        this.chartControl.DataSource = this.dataSource;

        this.chartControl.Series[0].XValueMember = "Year";
        this.chartControl.Series[0].YValueMembers = "Price";

        this.chartControl.Titles.Add(
            new Title("2000년 ~ 2006년 매출 실적 추이", Docking.Top,
                        new Font("Malgun Gothic", 20, FontStyle.Bold), Color.Black)
            );

        ChartArea chArea = this.chartControl.ChartAreas[0];

        chArea.BackColor = Color.LightGray;

        chArea.AxisX.MajorGrid.Enabled = false;
        chArea.AxisX.MajorTickMark.TickMarkStyle = TickMarkStyle.InsideArea;
        chArea.AxisX.IsMarginVisible = false;

        chArea.AxisY.MajorGrid.LineDashStyle = ChartDashStyle.Dot;
        chArea.AxisY.MajorTickMark.TickMarkStyle = TickMarkStyle.InsideArea;
        chArea.AxisY.Maximum = 0.0 / 0.0;
        chArea.AxisY.Interval = 1000000;
        chArea.AxisY.LabelStyle.Format = "#,##0;#,##0;-";

        Series chartSeries = this.chartControl.Series[0];

        chartSeries.ChartType = SeriesChartType.Area;
        chartSeries.Color = Color.LightBlue;
        chartSeries.BorderColor = Color.Black;
        chartSeries.BorderWidth = 1;

        this.chartControl.Legends.RemoveAt(0);
    }
}'C# > Winform (.Net Framework)' 카테고리의 다른 글
| C# - Winform Chart Control Example (5) (0) | 2025.01.22 |
|---|---|
| C# - Winform Chart Control Example (4) (0) | 2025.01.21 |
| C# - Winform Chart Control Example (2) (1) | 2025.01.20 |
| C# - Winform Chart Control Example (1) (1) | 2025.01.08 |
| C# - Winform TextureBrush를 사용한 애니메이션 처리 (0) | 2024.12.30 |


